Every field.
Every scan.
Understood.
Yield Metrics is AI for the farm. Autonomous cameras image every field from fixed points, as often as you need, and computer vision turns the images into numbers: plants counted, people and machines detected, growth measured.
- of acreage, every scan
- 100%
- station repeatability
- ±2 cm
- imaged per 15-minute scan
- 100+ ac
- photos reviewed by hand
- 0
You can only manage what you can see.
A farm is a thousand small decisions made on stale information. Yield Metrics replaces the weekly scouting trip with an AI system that looks at every field as often as you want and tells you what changed. Every field scouted, every day, without a scout. Every plant counted. Every crew accounted for. Every field compared against itself, last scan.
PILOT-PROGRAM TARGETS · RESULTS VARY BY CROP, CLIMATE AND OPERATION
A camera on a pole watching every field. Without the pole.
Every station is a precise GPS coordinate, a height, a heading and a camera tilt. The system returns to it within two centimeters, scan after scan, and takes the same picture. Day after day. Week after week. Year after year. It is everything a permanent camera tower would give you, for every field at once, with nothing to build, power, cable or maintain. And because the frame never moves, Yield Metrics can compare today to yesterday directly, and change is the only thing that shows.
- One point in space, kept foreverStations are surveyed once. From then on the same frame lines up pixel for pixel, so change is the only thing that moves.
- As many stations as you wantFour angles on a field, or forty. Adding a point of view is a line in a plan, not a trench and a tower.
- Years of history, nothing in the groundCompare this season to the last three from the same spot. No masts in the way of the tractor, no cameras to weather.
A season you can scrub like a video.
Because every photograph is taken from the exact same point in space, at the exact same angle, the season becomes a single continuous record. Bare dirt to harvest, scan by scan, pixel for pixel. Who was in the field, what machine was running, and how tall the corn stood, all in the same frame.
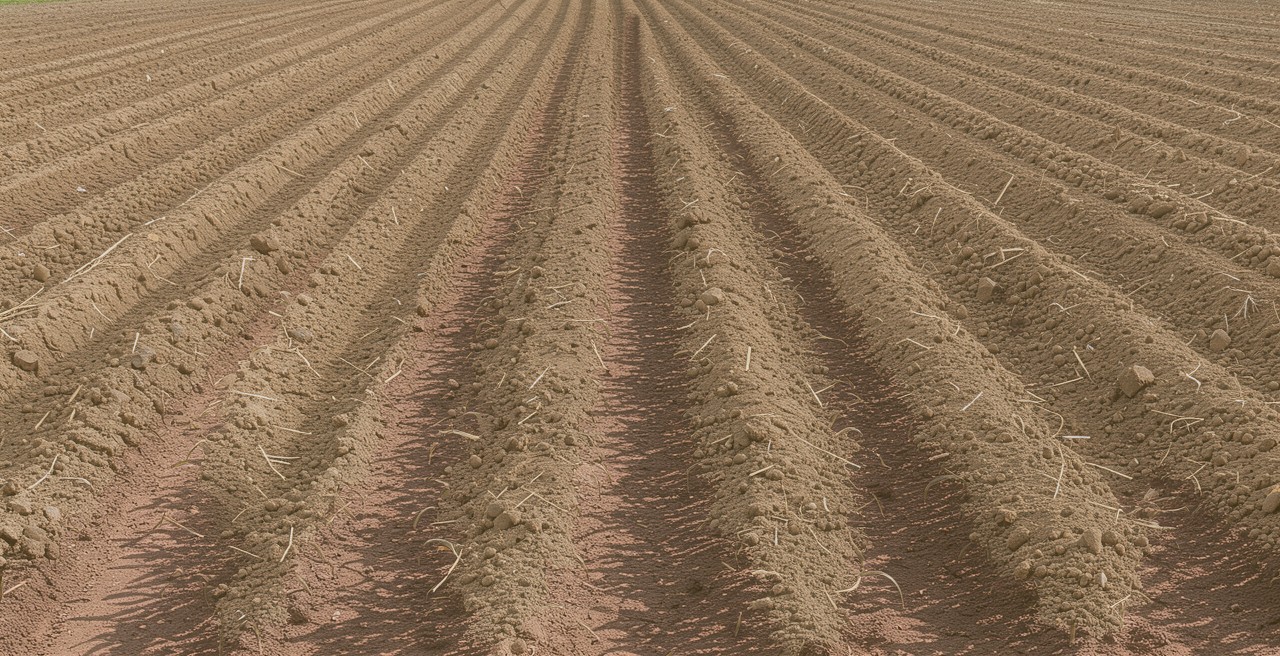
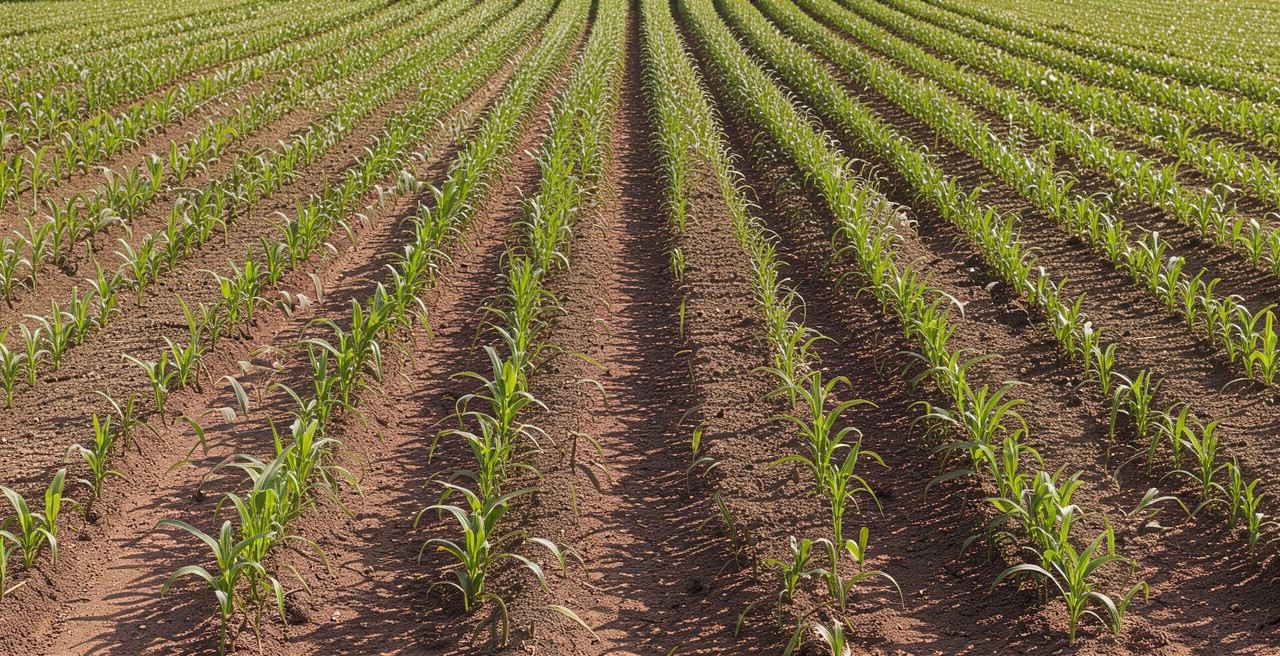
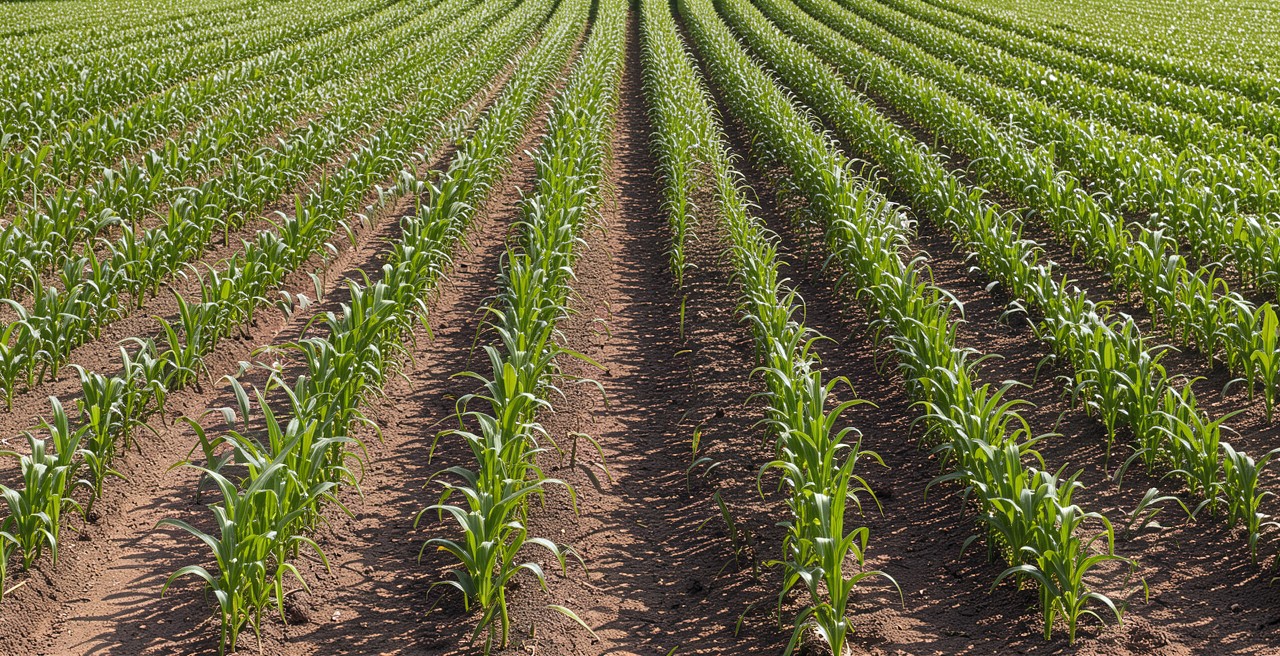
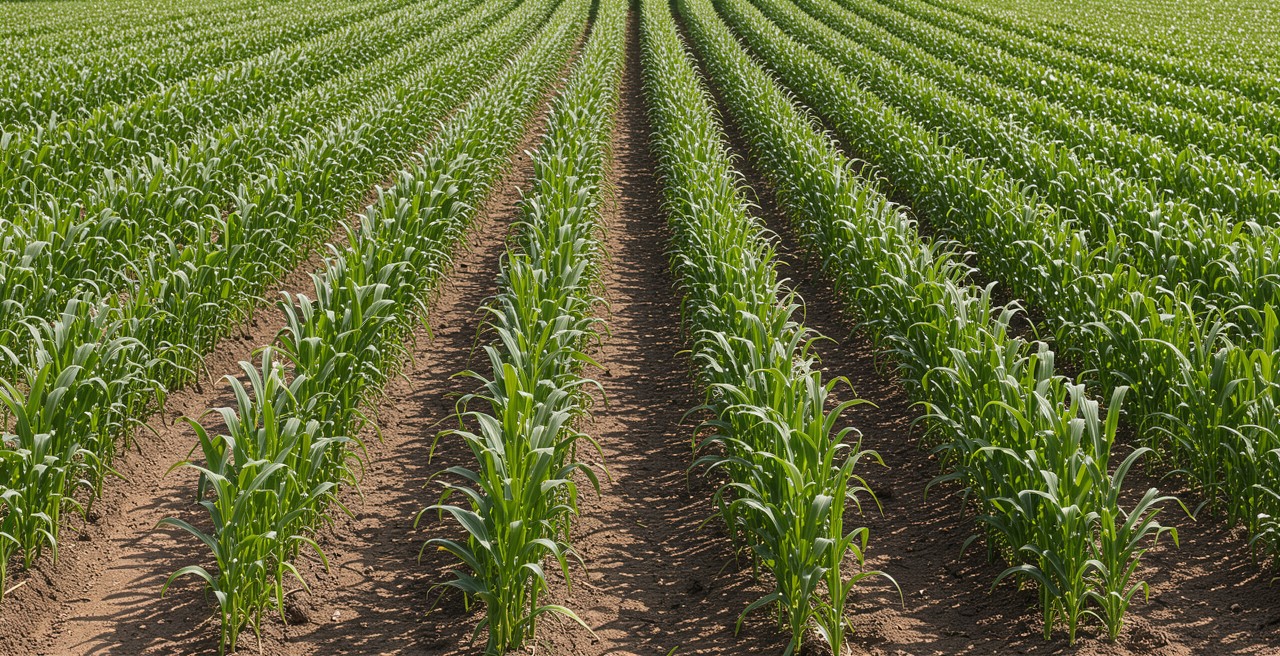
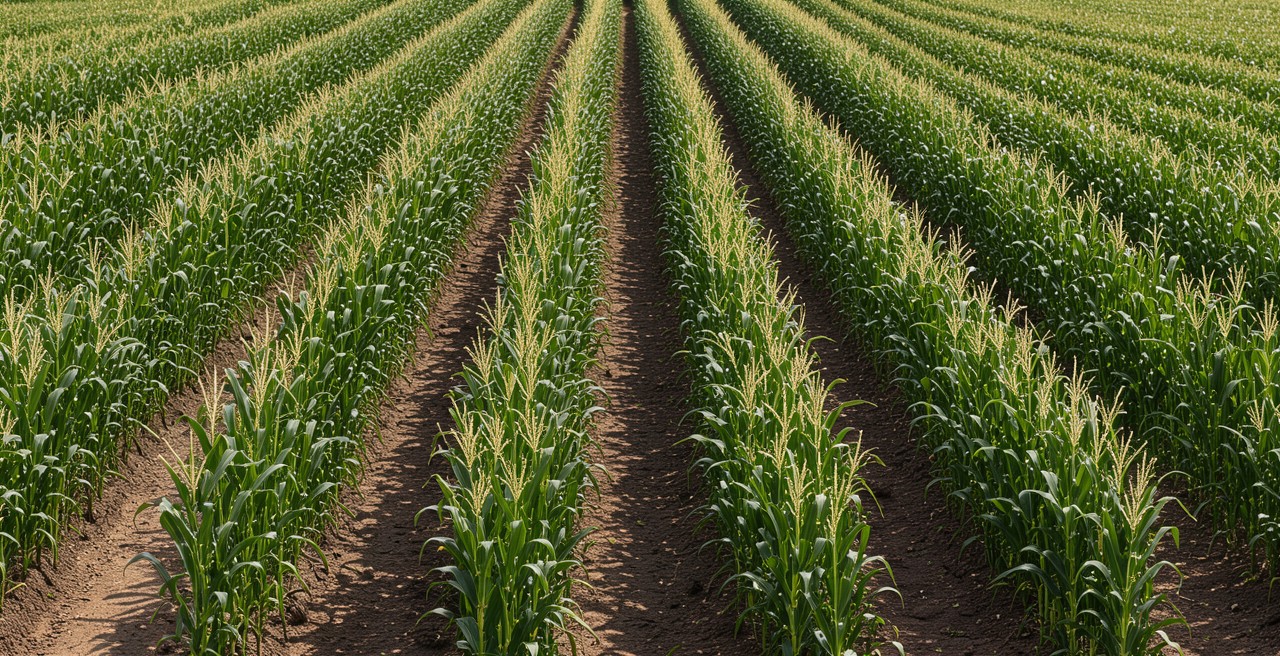
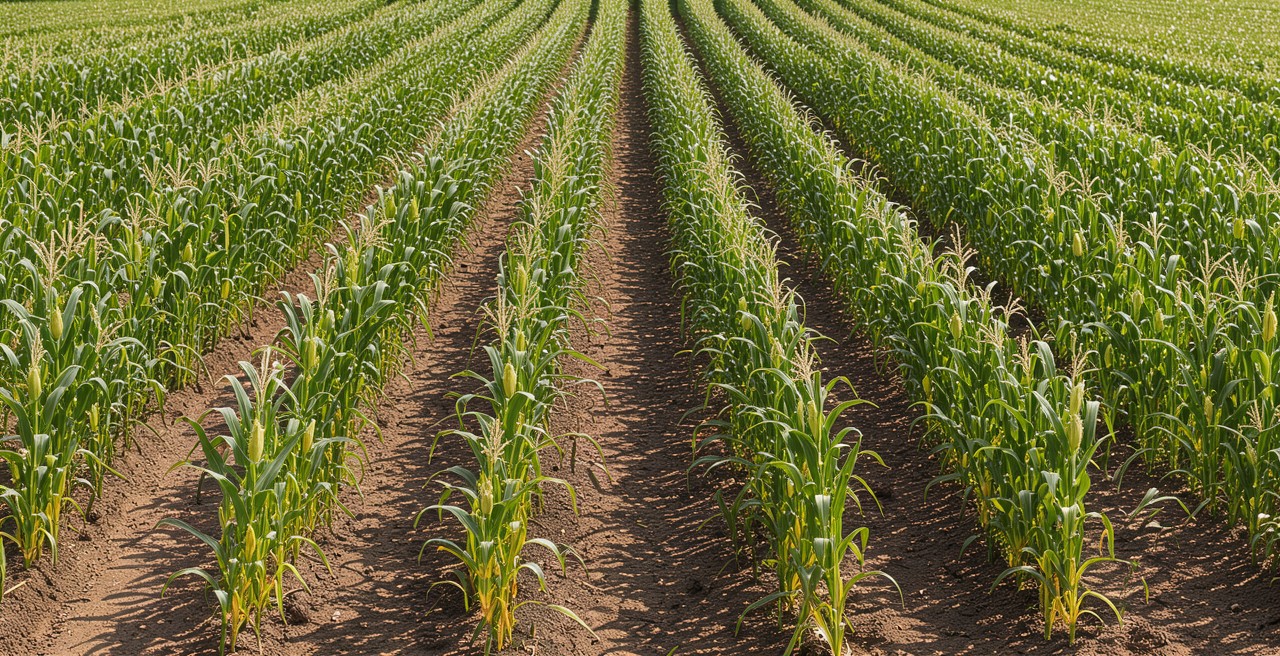
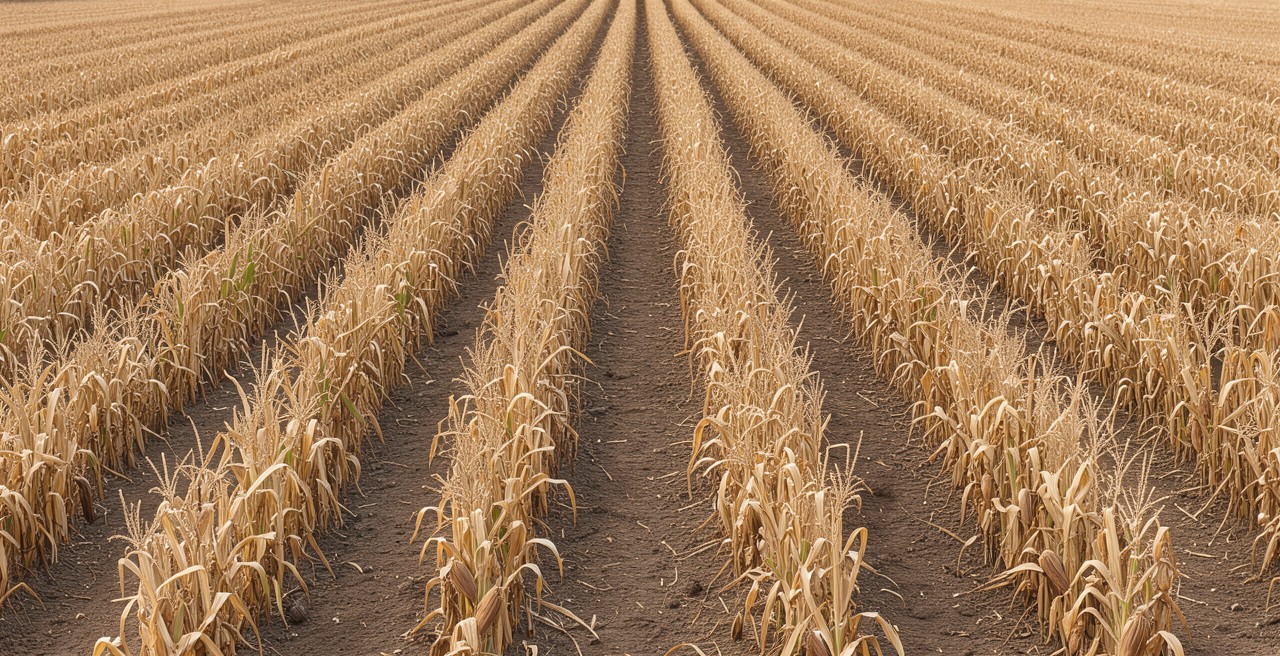
Planted
Seedbed prepared, planting done. Field empty.
- Height
- 0 cm
- People
- 0
- Machines
- 0
FIELD 7 · STATION 14 · 2026 SEASON · FRAMES ALIGNED TO ±2 CM · METRICS ILLUSTRATIVE
The camera is the easy part. Yield Metrics knows what should be happening, and makes sure that it is.
Yield Metrics is an AI system that watches your fields against your plan. It reads every scan, checks that the scheduled work is actually happening, alerts the people who can act, and gives managers the field on a screen instead of a windshield.
Reads every image
Computer vision aligns each scan to the last from the same station, counts the plants along every row, and detects and classifies every person and machine on the field. Every frame is read the moment it lands.
Checks the plan against the field
Yield Metrics knows what is scheduled for each field, planting, spraying, cultivation, harvest, and confirms from the imagery that the right activity happened in the right place at the right time.
Tells the right person when scheduled events don't occur
When a scheduled activity has not happened on a field, or a crew's pace has dropped, Yield Metrics messages the crew boss and the operator automatically, with the frames that show it.
Flags what needs a human look
Standing water, gaps in the stand, lodging, a pest front, a machine where it should not be. Anything that departs from the field's own history raises an alert to the manager, with the evidence attached.
Puts the field on your screen
Near real-time analysis of any field from anywhere: the latest scan, the one before it, and the numbers between them, without driving out to see it.
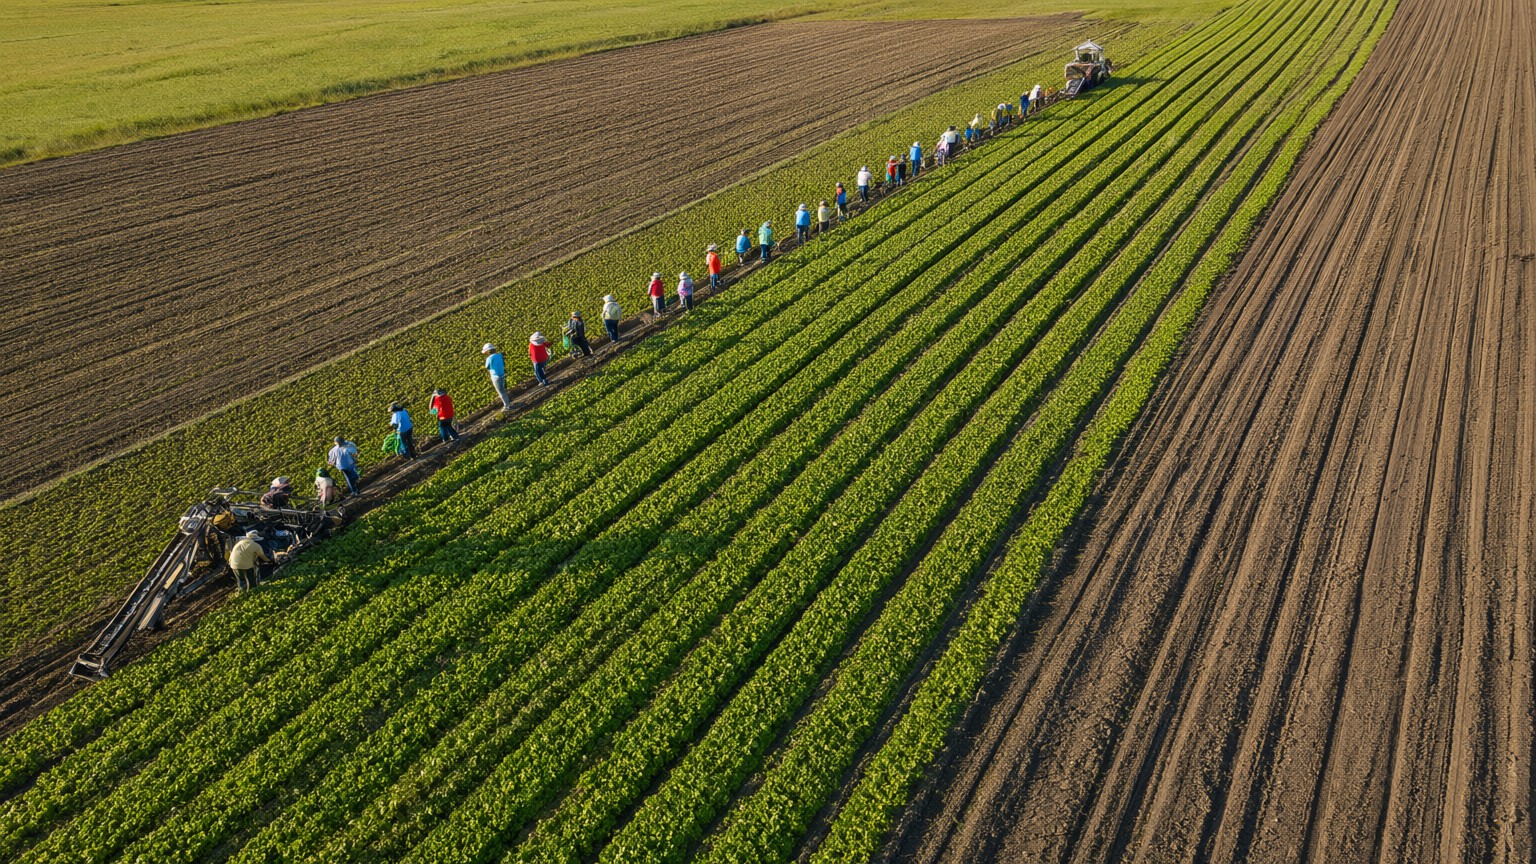
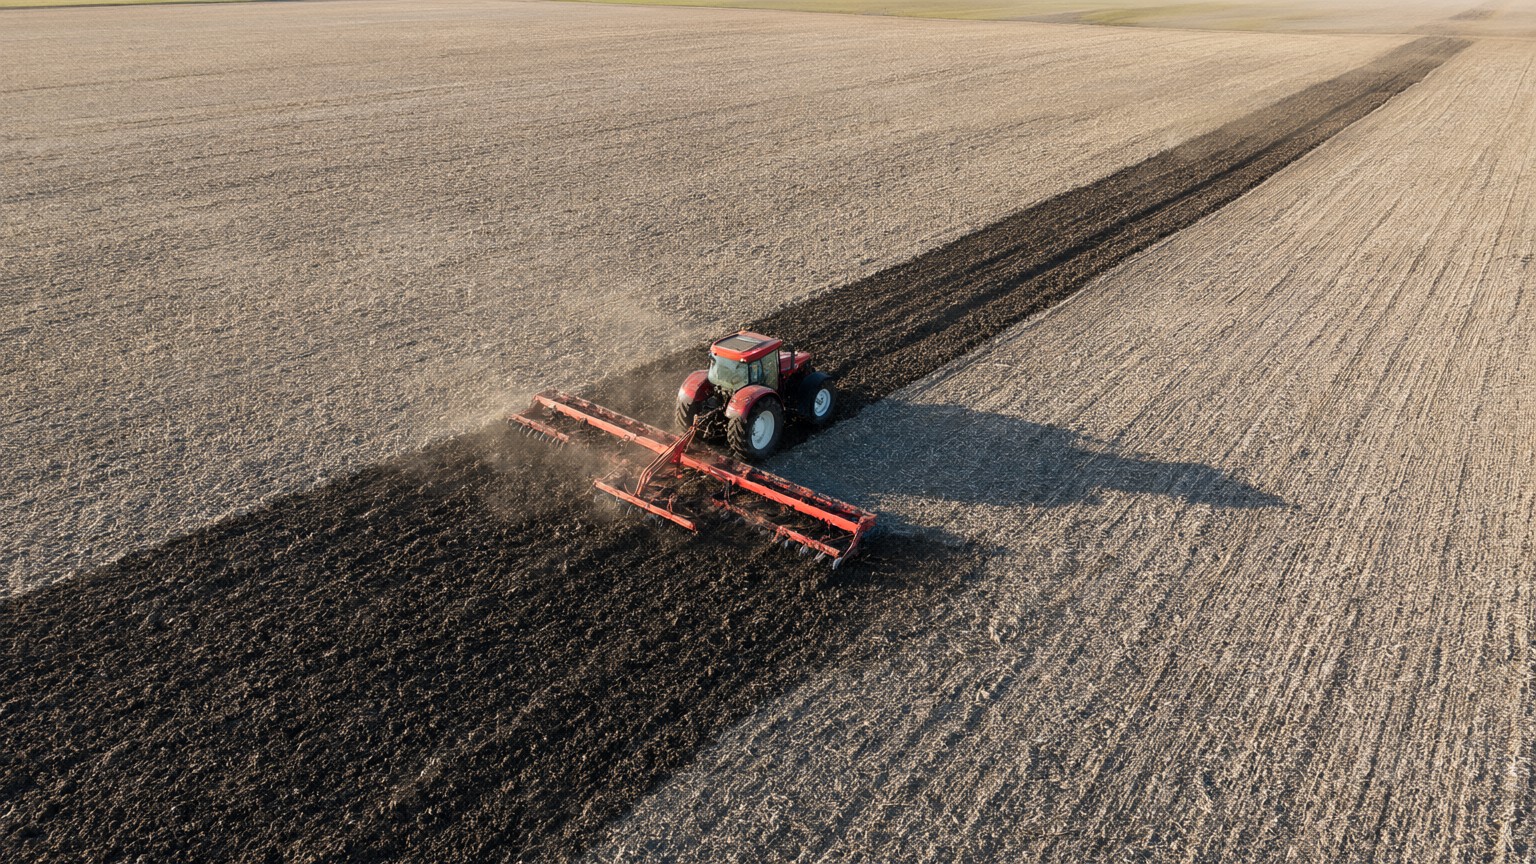
Fixed points. Fixed angles. Any cadence. Read by Yield Metrics.
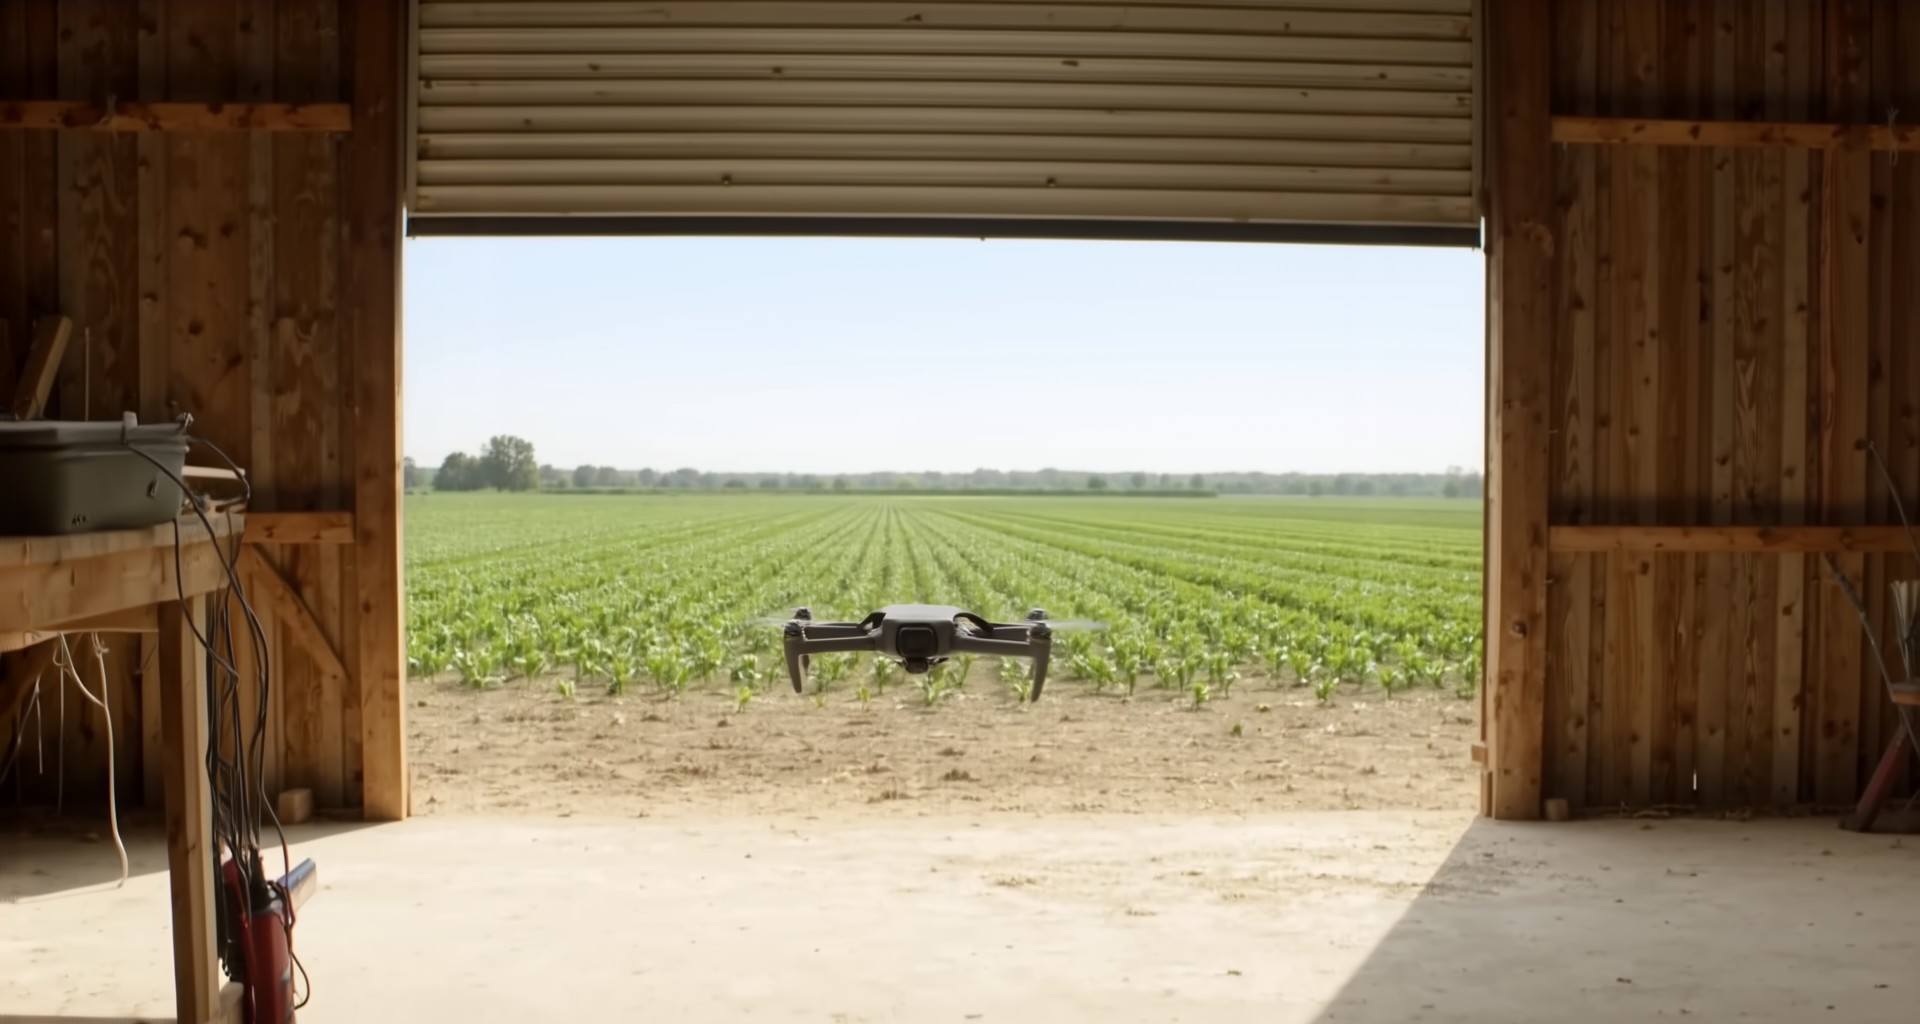
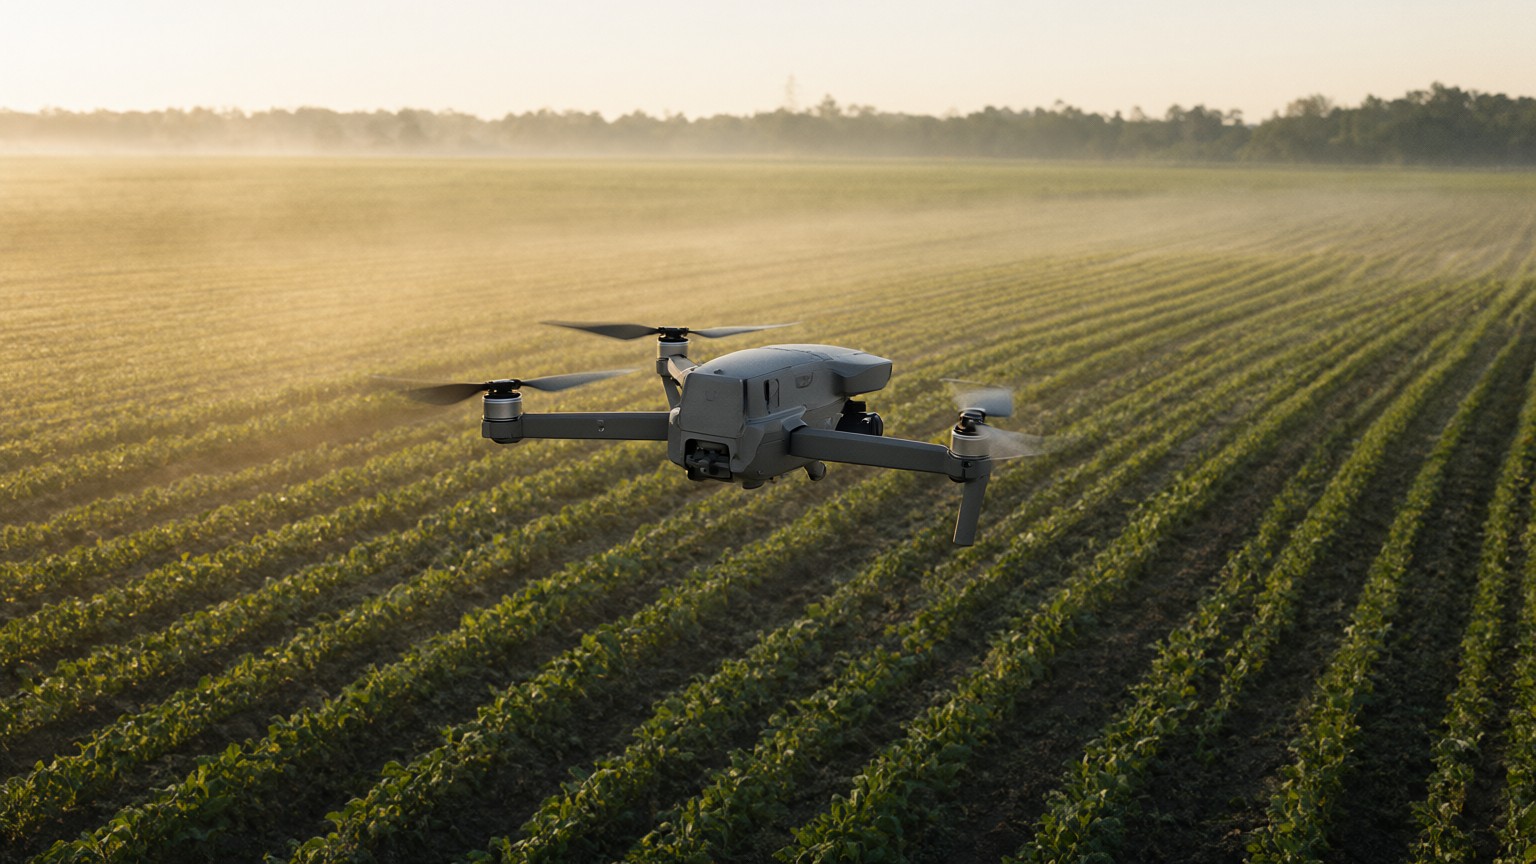
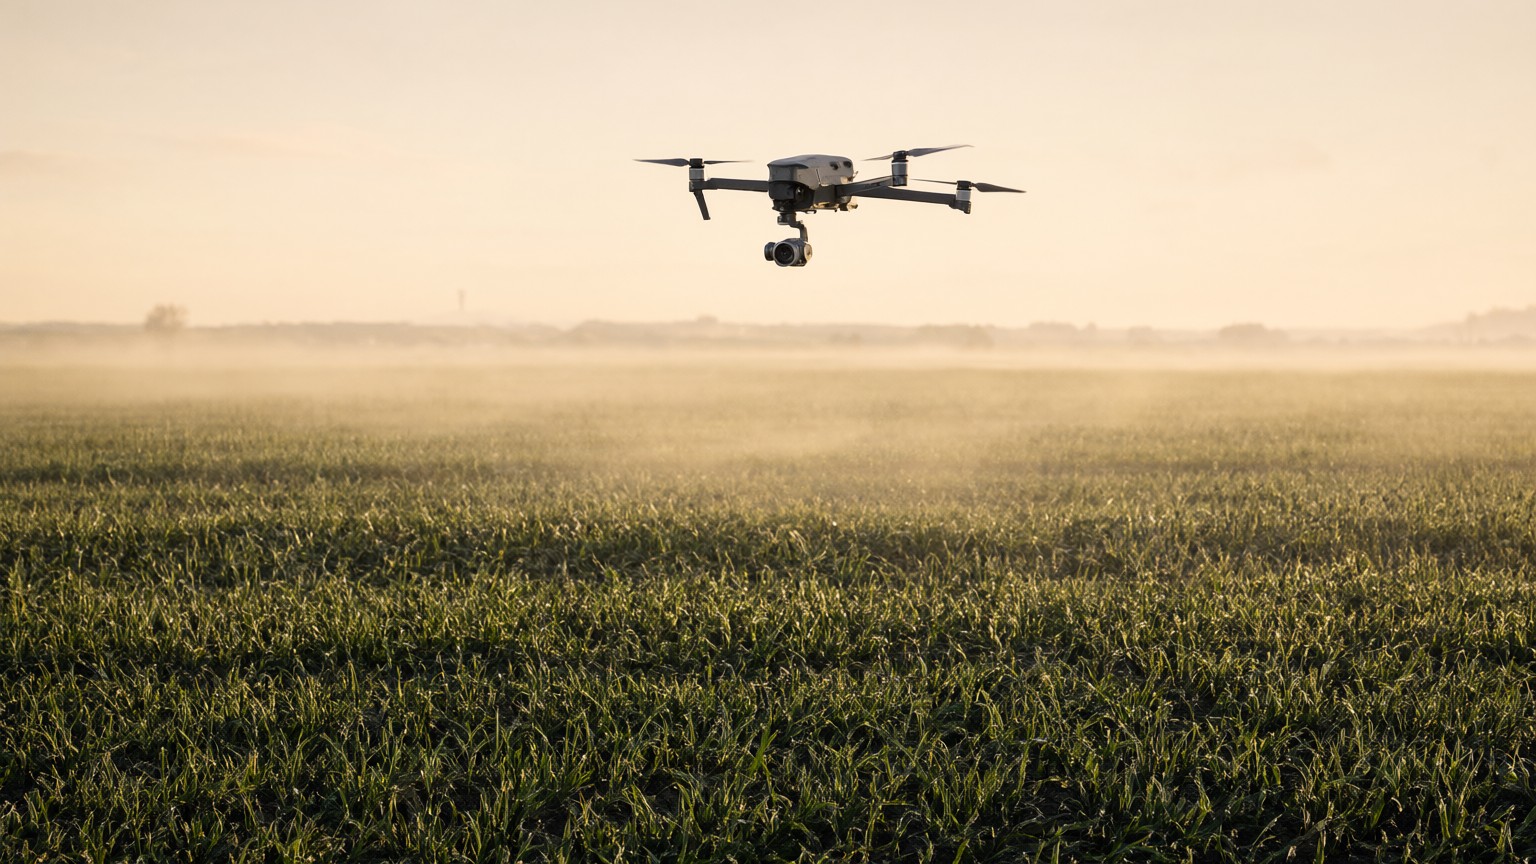
- 01
Scheduled, not operated.
The system decides when to image: once a day, every hour, or around a harvest shift. Aerial drones are our starting point; ground units and fixed cameras feed the same pipeline.
- 02
Fixed stations.
Every field is surveyed once into a set of precise points: GPS coordinate, height, heading, tilt. The sensor returns to each one within two centimeters.
- 03
The same frame, every scan.
Multiple angles per field, locked heading and tilt, consistent exposure. Images that line up scan after scan without warping or guesswork.
- 04
Read by Yield Metrics within minutes.
Vision models align each frame to the last scan, segment and count plants, detect people and machines, and score every field against its own history. Every scan is read in full, automatically.
We don't just watch your fields. We measure them.
Imagery is the raw material; Yield Metrics turns it into numbers your agronomist and your crew boss can both act on: plants, people, machines, percentages, and the trend line that tells you whether this scan was better than the last.
Plants that germinated
Stand counts per row, per field, from the first scan after emergence. Replant decisions in days, not weeks.
Canopy and vigor
Percent cover, growth rate, and color indices tracked against your own prior seasons, not a generic model.
People on the field
Each person detected and counted: how many, where, for how long. Aggregated into crew and shift output.
Machines and operations
Tractors, implements and rigs identified by type. Tillage, planting, spraying and harvest measured as percent of field complete.
Anomalies
Standing water, washouts, gaps, lodging, pest fronts. If a patch of the field changes faster than its neighbors, you hear about it.
Harvest progress
Rows cleared per shift. Bins staged. Trucks loaded. The end of the season, quantified while it is happening.
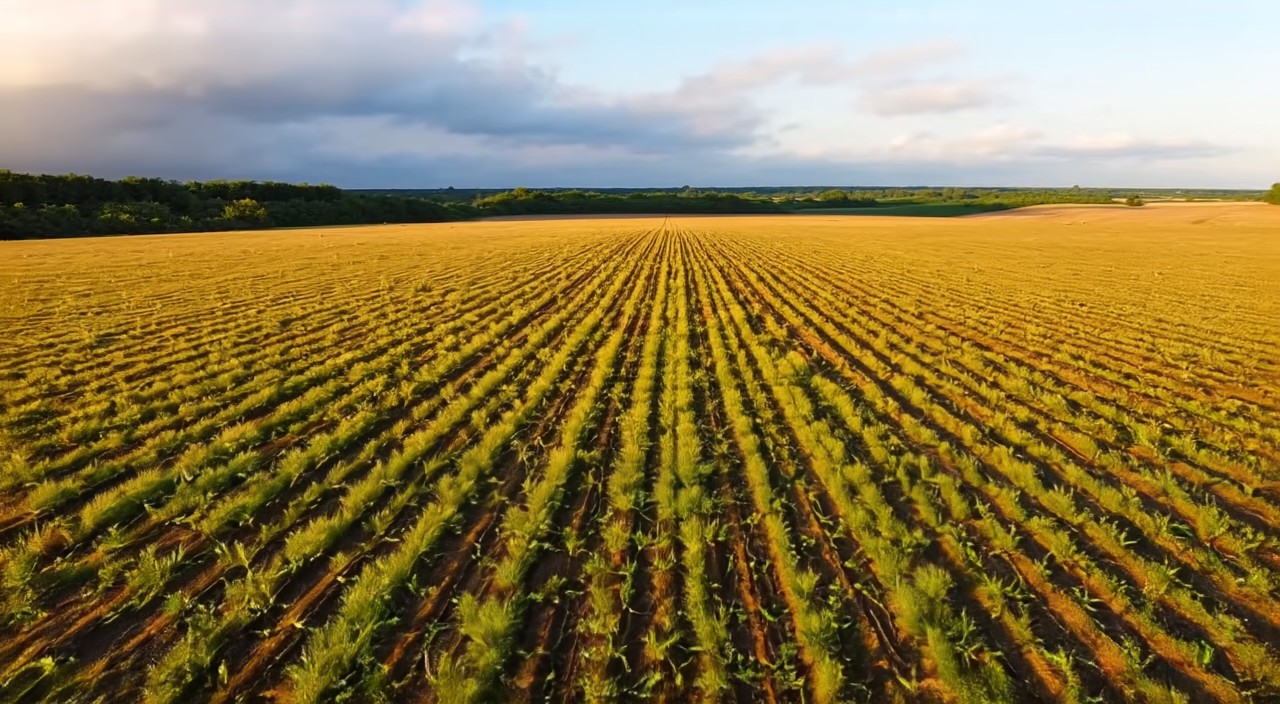
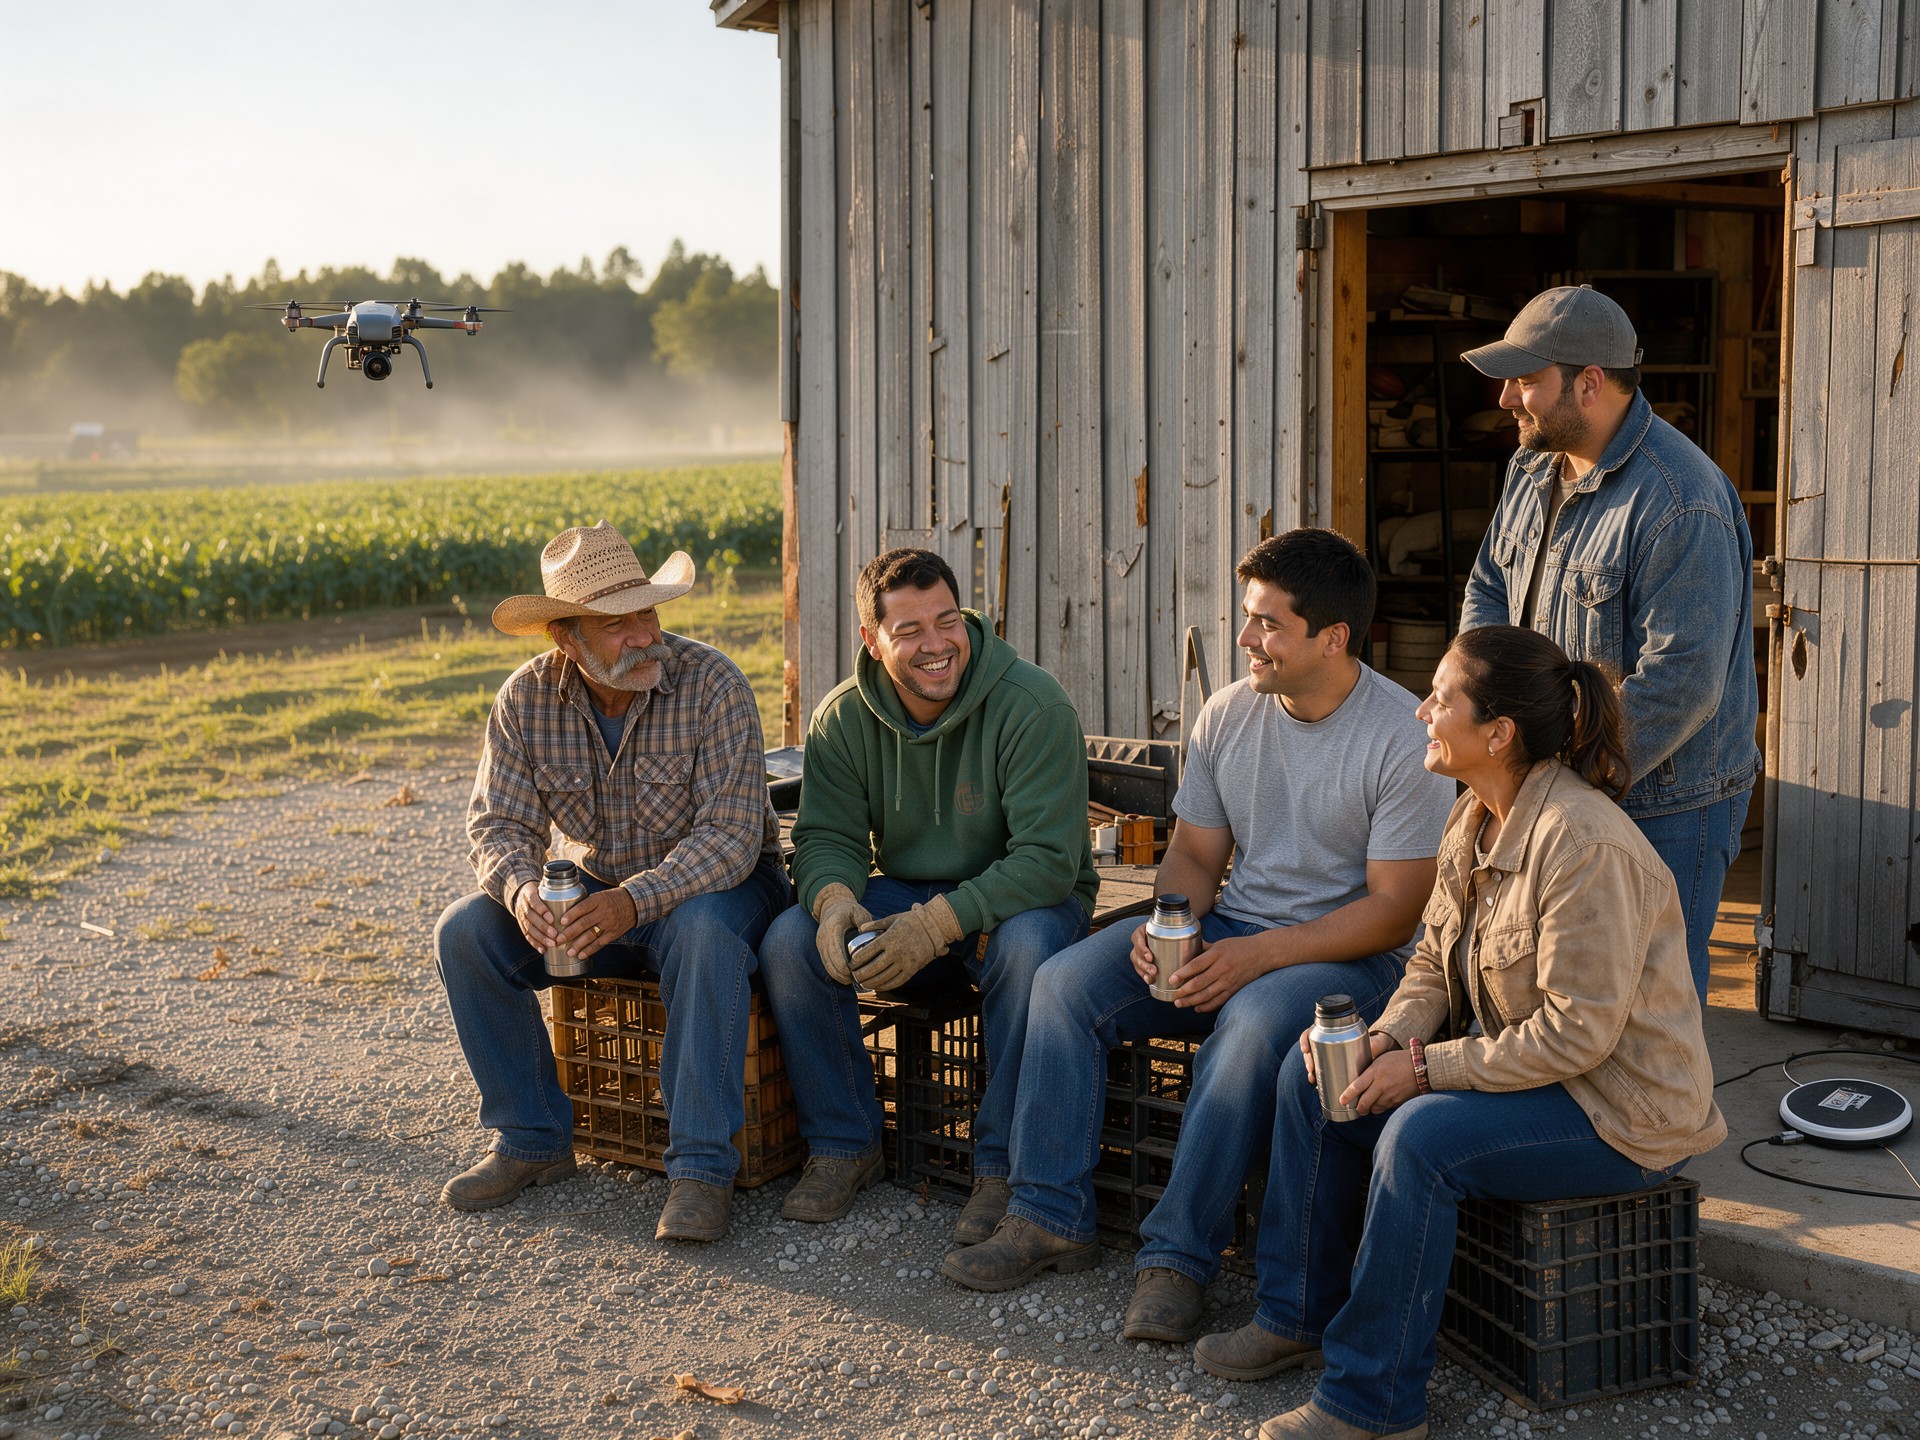
Yield Metrics writes the report. Every field, every team, as often as you need it.
| FIELD | ACTIVITY | PROGRESS | LAST 14 SCANS | SINCE LAST SCAN |
|---|---|---|---|---|
| Field 3 | Tillage | 61% | +9 pts | |
| Field 7 | Harvest | 48% | +640 cartons | |
| Field 9 | Canopy | 72% | +3 pts | |
| Field 12 | Stand | 88% | steady | |
| Field 14 | Standing water | 34% | ALERT · NE corner |
ILLUSTRATIVE DASHBOARD · FIGURES ARE EXAMPLES
Every aircraft, every field, right now.
The view a manager keeps open: where each aircraft is, which station it is capturing, how far each field has come, and what needs a human look.
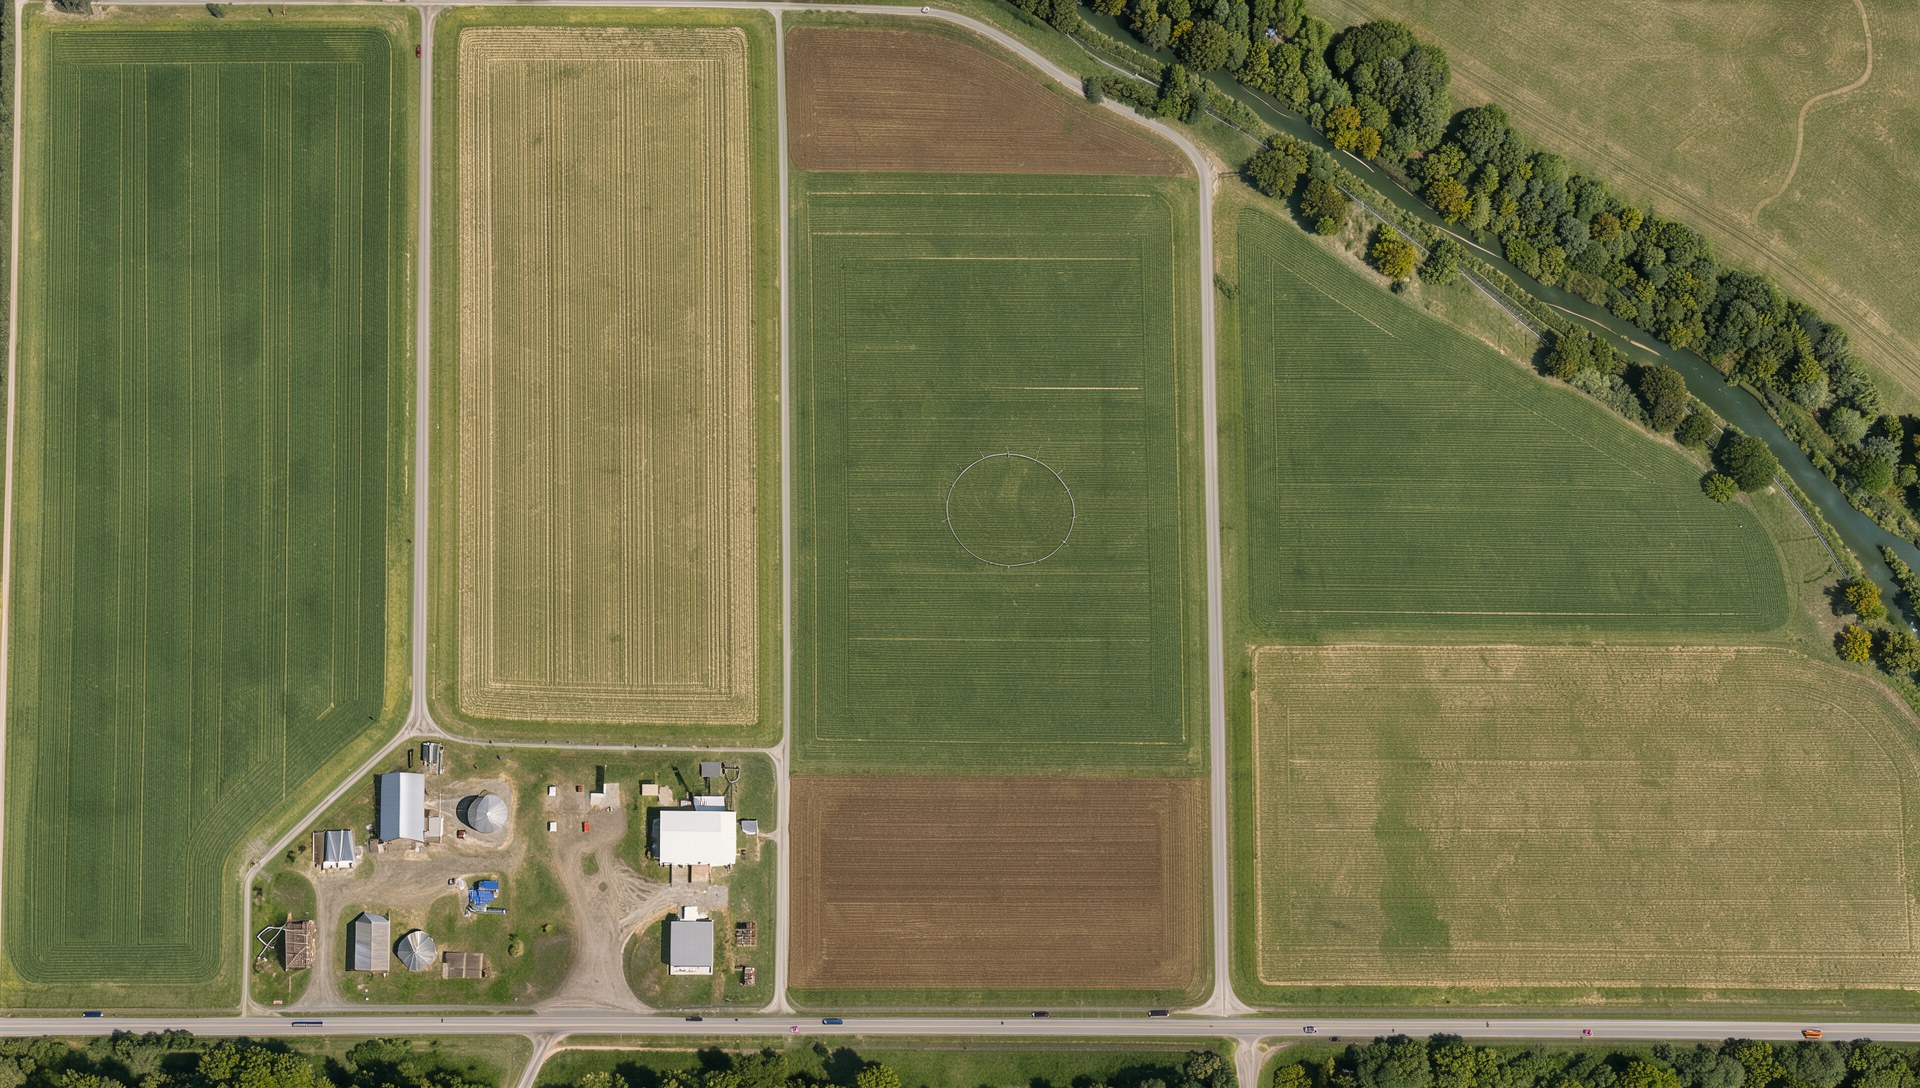
- Aircraft 1IN TRANSITScanning Field 12
- Aircraft 2IN TRANSITScanning Field 7
- Aircraft 3IN TRANSITScanning Field 14
- Field 12 · Corn · V888%
- Field 14 · Corn · V834%
- Field 3 · Corn · tillage61%
- Field 7 · Lettuce · harvest48%
- Field 9 · Soy · canopy72%
- 14:02 Field 14: standing water in the NE corner, flagged for the manager.
- 13:48 Field 7: harvest pace 11 rows per shift, on plan. Crew boss notified.
- 13:30 Field 3: tillage 61% complete, scheduled finish tomorrow.
ILLUSTRATIVE VIEW ON A SIMULATED CLOCK
Know what your crews did. Not what they said they did.
Cartons per crew-hour, bins per shift, acres harvested, people on field, pace against the last shift. Counted by Yield Metrics, not by a clipboard, and shared with the crew bosses who earn it. Teams that see their own numbers compete with themselves, and the whole operation moves faster.
- Shift scorecardsCartons, bins and acres per crew, per field, per shift, delivered to the crew boss as the shift ends.
- Fair, automatic, consistentThe same camera, the same angle, the same math for every team, every scan.
- Fewer surprisesA crew that fell behind on Tuesday is a conversation on Wednesday morning, not a problem in September.
Three things, and your farm is cleared to fly. We handle all of them.
Airspace is federal even over your own land, so deploying Yield Metrics in the United States comes with a short list of requirements. All three are routine, and Yield Metrics takes care of them so your first scan is a matter of weeks, not paperwork.
- 01
A certified pilot, yours or ours.
Every commercial drone operation in the United States needs a certified remote pilot in command under FAA Part 107. Yield Metrics provides one: on site for your first season, and from our operations center once unattended flight is approved. If you would rather have your own, a farm manager or agronomist earns the certificate in a few weeks of study, no flying required, and we supply the course.
OUR PART · OR YOURS, YOUR CHOICE - 02
Registered aircraft, broadcasting Remote ID.
Each aircraft is registered with the FAA and broadcasts its identity and position in flight. The docks and aircraft we deploy do this out of the box. We register them in your name as part of installation, and the system keeps the flight logs the FAA expects.
OUR PART · DONE AT INSTALL - 03
A waiver for unattended flight.
Flying without a person watching the aircraft is a beyond-visual-line-of-sight operation, which the FAA approves per operator and location. Low-altitude flights over your own farmland are among the most straightforward cases there are. We prepare and file the application for you, using the flight plans, altitudes and safety case from your survey, and your system flies under supervision until it is granted.
OUR PART · FILED WITH YOUR SURVEY
THE FAA'S PART 108 RULE, EXPECTED TO TAKE EFFECT IN 2027, REPLACES STEP 03 WITH A STANDARD APPROVAL. YIELD METRICS IS BUILT TO MEET IT.
One season with Yield Metrics watching every field will tell you more than the last ten did.
We are taking a limited number of operations for the 2027 pilot. Stations surveyed, hardware installed, and measurement running within weeks, in time for planting.